Đây là bài giảng giới thiệu về Phân loại hình ảnh (Image Classification) cho người mới bắt đầu dựa trên hướng tiếp cận vào dữ liệu. Nội dung bao gồm:
- Giới thiệu về Phân loại hình ảnh, cách tiếp cận hướng dữ liệu (data-driven), pipeline
- Bộ phân loại dựa trên PP Các láng giềng gần nhất (Nearest Neighbor)
- Tập kiểm định, Kiểm định chéo, tinh chỉnh siêu tham số
- Ưu/nhược điểm của PP Các láng giềng gần nhất
- Tổng kết
- Tổng kết: Áp dụng kNN
- Tài liệu khác
Phân loại hình ảnh
Động lực. Trong phần này chúng tôi sẽ giới thiệu về bài toán Phân loại hình ảnh (Image Classification), đây là bài toán chúng ta sẽ phải gán ảnh đầu vào với một tập nhãn cố định cho trước. Đây là một trong những vấn đề cốt lõi trong Thị giác máy tính, bất chấp sự đơn giản của nó, có nhiều ứng dụng vào thực tế. Hơn nữa, như chúng ta đã thấy ở bài trước, nhiều bài toán cụ thể khác trong Thị giác máy tính (như phát hiện vật thể, phân vùng), có thể được quy về việc phân loại.
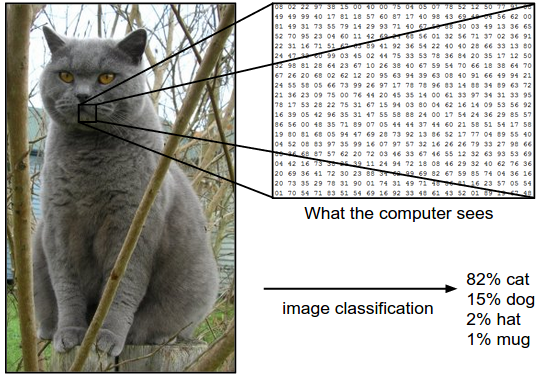
Ví dụ. Cho ví dụ, trong hình dưới đây một mô hình phân loại hình ảnh nhận một bức ảnh và đưa ra xác suất cho 4 nhãn, {cat, dog, hat, mug}. Như trong hình, ta nhớ rằng máy tính biểu diễn hình ảnh dưới dạng một ma trận 3 chiều lớn. Trong ví dụ này, tấm hình con mèo gồm 248 pixels chiều rộng, 400 pixels chiều dài, và 3 kênh màu Red,Green,Blue (gọi tắt là RGB). Vì vậy, tấm ảnh chứa 248 x 400 x 3 = 297,600 số. Mỗi số là một số nguyên nằm trong khoảng từ 0 (đen) đến 255 (trắng). Nhiệm vụ của chúng ta là biến 1/4 triệu số này thành 1 nhãn, ví dụ như “cat”.
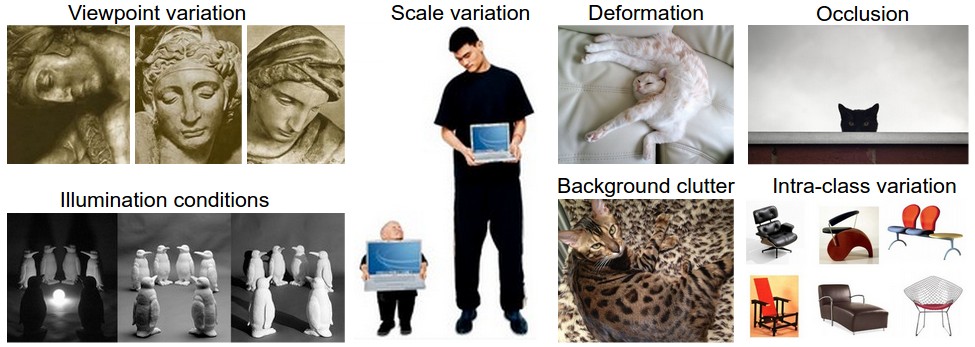
Thử thách. Vì nhiệm vụ nhận biết một khái niệm trực quan (ví dụ: con mèo) tương đối tầm thường đối với con người để thực hiện, nên đáng để xem xét các thách thức liên quan từ quan điểm của thuật toán Thị giác máy tính. Như chúng tôi trình bày (một danh sách đầy đủ) các thách thức dưới đây, nhớ lại rằng biểu diễn thô của hình ảnh dưới dạng mảng 3 chiều của các giá trị độ sáng:
- Đa dạng góc nhìn (viewpoint variation). Một thực thể của đối tượng có thể được nhìn theo hướng của máy ảnh.
- Đa dạng tỉ lệ (scale variation). Các lớp trực quan thường thể hiện sự thay đổi về kích thước của chúng (kích thước trong thế giới thực, không chỉ về mức độ của chúng trong hình ảnh).
- Biến dạng (deformation). Nhiều đối tượng quan tâm không có thân thể cứng nhắc và có thể bị biến dạng theo những cách cực đoan.
- Sự che khuất (occlusion). Nhiều đối tượng được quan tâm có thể bị che khuất. Đôi lúc chỉ có một phần nhỏ của đối tượng (một lượng nhỏ điểm ảnh) có thể được hiển thị.
- Các điều kiện ánh sáng (illumation). Các ảnh hưởng của ánh sáng ảnh rất mạnh tới mức độ của các điểm ảnh.
- Nhiễu nền (background clutter). Nhiều đối tượng được quan tâm có thể ‘hòa’ vào với môi trường, khiến chúng khó có thể nhận ra.
- Đa dạng trong một lớp (intra-class variation). Các lớp quan tâm thường có thể tương đối rộng, chẳng hạn như ghế. Có nhiều loại khác nhau của các đối tượng này, mỗi loại có ngoại hình riêng.
Một mô hình phân loại ảnh tốt phải bất biến đối với tất cả các sự thay đổi, đồng thời duy trì độ nhạy với các biến thể giữa các lớp.
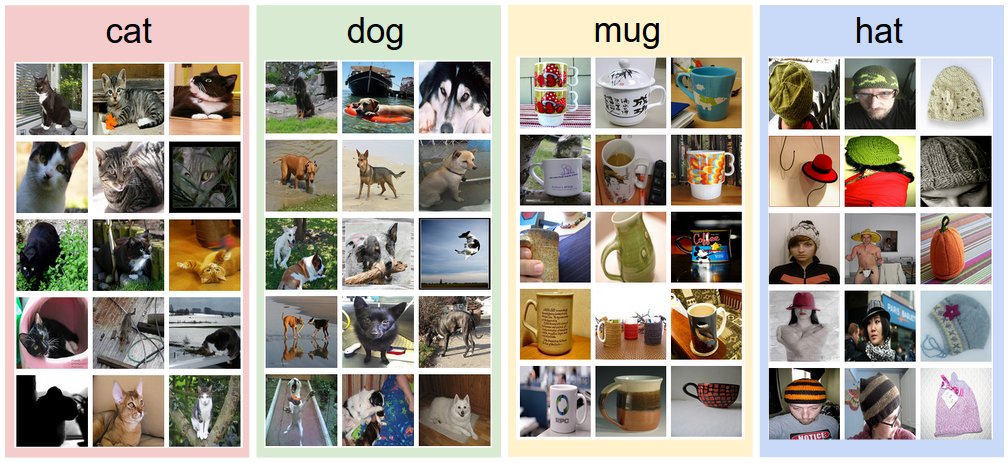
Cách tiếp cận hướng dữ liệu (data-driven). Làm thế nào chúng ta có thể viết về một thuật toán có thể phân loại hình ảnh thành các loại khác nhau? Không giống như viết một thuật toán, ví dụ, sắp xếp một danh sách các số, không rõ ràng làm thế nào người ta có thể viết một thuật toán để xác định mèo trong hình ảnh. Do đó, thay vì cố gắng chỉ định mỗi một loại danh mục sở thích trông như thế nào trong mã, cách tiếp cận mà chúng tôi sẽ thực hiện không giống với cách bạn sẽ làm với một đứa trẻ: chúng tôi sẽ cung cấp cho máy tính nhiều ví dụ về mỗi lớp và sau đó phát triển các thuật toán học tập xem xét các ví dụ này và tìm hiểu về sự xuất hiện trực quan của mỗi lớp. Cách tiếp cận này được gọi là một cách tiếp cận dựa trên dữ liệu, vì nó dựa vào lần đầu tiên tích lũy một tập dữ liệu huấn luyện các hình ảnh được dán nhãn. Dưới đây là một ví dụ về những gì một bộ dữ liệu như vậy có thể trông như thế nào:
Phân loại hình ảnh pipeline. Chúng ta đã thấy rằng nhiệm vụ trong Phân loại hình ảnh là lấy một mảng các pixel đại diện cho một hình ảnh duy nhất và gán nhãn cho nó. Our complete pipeline can be formalized as follows:
- Đầu vào: Đầu vào của chúng ta bao gồm một tập gồm N ảnh, mỗi ảnh được gán với một trong K lớp khác nhau. Chúng tôi gọi dữ liệu này là tập huấn luyện.
- Quá trình học: Nhiệm vụ của chúng ta là sử dụng tập huấn luyện để để học thể hiện của mọi lớp. Chúng ta gọi bước này là huấn luyện một bộ phân loại, hoặc học một mô hình.
- Đánh giá: Cuối cùng, chúng ta đánh giá chât lượng của mô hình bằng việc sử dụng nó để dự đoán các nhãn cho một tập ảnh mà nó chưa thấy trước đây. Sau đó chúng ta so sánh nhãn thật sự của những ảnh này với những nhãn được dự đoán bởi mô hình. Bằng trực giác, chúng ta hi vọng có nhiều dự đoán trùng với câu trả lời đúng (thứ mà chúng ta sẽ gọi là ground truth).
Bộ phân loại dựa trên PP các láng giềng gần nhất (Nearest Neighbor)
Trong cách tiếp cận đầu tiên, chúng ta sẽ phát triển Bộ phân loại láng giềng gần nhất. Bộ phân loại này không liên quan gì đến Mạng nơ-ron tích chập và nó rất hiếm khi được sử dụng trong thực tế, nhưng nó sẽ cho phép chúng ta có được ý tưởng về cách tiếp cận cơ bản đối với vấn đề phân loại ảnh.
Ví dụ tập dữ liệu phân loại hình ảnh: CIFAR-10. Một tập dữ liệu phân loại hình ảnh mẫu phổ biến là tập dữ liệu CIFAR-10 . Tập dữ liệu này bao gồm 60.000 hình ảnh nhỏ có chiều cao và chiều rộng 32 pixel. Mỗi ảnh được gắn nhãn bằng một trong 10 lớp (ví dụ “airplane, automobile, bird, vân vân”). 60.000 hình ảnh này được chia thành tập huấn luyện 50.000 hình ảnh và tập kiểm thử 10.000 hình ảnh. Trong hình ảnh bên dưới, bạn có thể thấy 10 hình ảnh ví dụ ngẫu nhiên từ mỗi một trong 10 lớp:
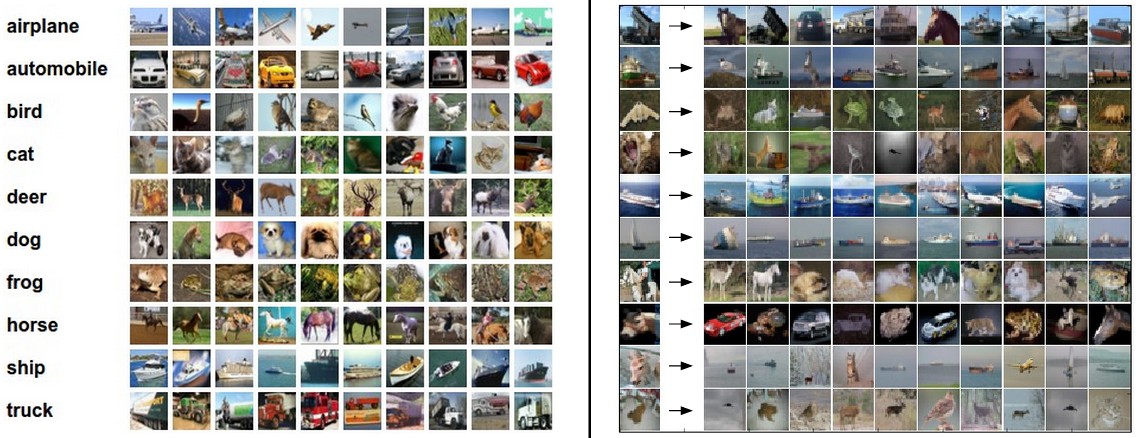
Giả sử bây giờ chúng ta được cung cấp tập huấn luyện CIFAR-10 gồm 50.000 hình ảnh (5.000 hình ảnh cho mỗi nhãn) và chúng ta muốn gắn nhãn 10.000 hình ảnh còn lại. Bộ phân loại láng giềng gần nhất sẽ lấy một hình ảnh thử nghiệm, so sánh nó với từng hình ảnh huấn luyện và dự đoán nhãn của hình ảnh huấn luyện gần nhất. Trong hình trên và bên phải, bạn có thể thấy kết quả ví dụ của quá trình như vậy cho 10 hình ảnh thử nghiệm ví dụ. Lưu ý rằng chỉ có khoảng 3 trong số 10 ví dụ, một hình ảnh của cùng một lớp được truy xuất, trong khi ở 7 ví dụ khác thì không. Ví dụ, ở hàng thứ 8, hình ảnh huấn luyện gần đầu ngựa nhất là một chiếc xe hơi màu đỏ, có lẽ là do nền đen mạnh. Kết quả là, hình ảnh con ngựa này trong trường hợp này sẽ bị gắn nhãn sai thành một chiếc xe hơi.
Bạn có thể nhận thấy rằng chúng tôi không xác định chi tiết chính xác về cách chúng tôi so sánh hai hình ảnh, trong trường hợp này chỉ là hai khối 32 x 32 x 3. Một trong những khả năng đơn giản nhất là so sánh các hình ảnh từng điểm ảnh và cộng lại tất cả sự khác biệt. Nói cách khác, với hai hình ảnh và biểu diễn chúng dưới dạng vectơ \ (I_1, I_2 \), một lựa chọn hợp lý để so sánh chúng có thể là khoảng cách L1:
\[d_1 (I_1, I_2) = \sum_{p} \left| I^p_1 - I^p_2 \right|\]Where the sum is taken over all pixels. Here is the procedure visualized: Tổng được lấy trên tất cả các điểm ảnh. Công thức được hình dung:

Let’s also look at how we might implement the classifier in code. First, let’s load the CIFAR-10 data into memory as 4 arrays: the training data/labels and the test data/labels. In the code below, Xtr (of size 50,000 x 32 x 32 x 3) holds all the images in the training set, and a corresponding 1-dimensional array Ytr (of length 50,000) holds the training labels (from 0 to 9):
Hãy cũng xem xét cách chúng ta có thể lập trình bộ phân loại. Đầu tiên, hãy tải dữ liệu CIFAR-10 vào bộ nhớ dưới dạng 4 mảng: dữ liệu/nhãn huấn luyện và dữ liệu/nhãn kiểm thử. Trong đoạn mã bên dưới, ‘Xtr’ (có kích thước 50.000 x 32 x 32 x 3) chứa tất cả các hình ảnh trong tập huấn luyện và mảng 1 chiều tương ứng ‘Ytr’ (có kích thước 50.000) chứa các nhãn huấn luyện (từ 0 đến 9):
Xtr, Ytr, Xte, Yte = load_CIFAR10('data/cifar10/') # a magic function we provide
# flatten out all images to be one-dimensional
Xtr_rows = Xtr.reshape(Xtr.shape[0], 32 * 32 * 3) # Xtr_rows becomes 50000 x 3072
Xte_rows = Xte.reshape(Xte.shape[0], 32 * 32 * 3) # Xte_rows becomes 10000 x 3072
Bây giờ chúng ta đã có tất cả các hình ảnh được trải thành hàng, đây là cách chúng ta có thể huấn luyện và đánh giá một bộ phân loại:
nn = NearestNeighbor() # create a Nearest Neighbor classifier class
nn.train(Xtr_rows, Ytr) # train the classifier on the training images and labels
Yte_predict = nn.predict(Xte_rows) # predict labels on the test images
# and now print the classification accuracy, which is the average number
# of examples that are correctly predicted (i.e. label matches)
print 'accuracy: %f' % ( np.mean(Yte_predict == Yte) )
Lưu ý rằng để đánh giá, người ta thường sử dụng độ chính xác, đo lường khả năng dự đoán đúng. Lưu ý rằng tất cả các bộ phân loại mà chúng ta sẽ xây dựng đều đáp ứng một API chung này: chúng có hàm ‘train(X, y)’ lấy dữ liệu và nhãn để học. Trong nội bộ, một lớp nên xây dựng một vài mô hình nhãn và cách chúng có thể được dự đoán từ dữ liệu. Và sau đó có một hàm ‘predict(X)’, lấy dữ liệu mới và dự đoán các nhãn. Tất nhiên, chúng ta đã bỏ đi phần chi tiết của mọi thứ - bộ phân loại thực tế. Đây là cách triển khai bộ phân loại láng giềng gần nhất đơn giản với khoảng cách L1 thỏa mãn mẫu này:
import numpy as np

class NearestNeighbor(object):
  def __init__(self):
    pass

  def train(self, X, y):
    """ X is N x D where each row is an example. Y is 1-dimension of size N """
    # the nearest neighbor classifier simply remembers all the training data
    self.Xtr = X
    self.ytr = y

  def predict(self, X):
    """ X is N x D where each row is an example we wish to predict label for """
    num_test = X.shape[0]
    # lets make sure that the output type matches the input type
    Ypred = np.zeros(num_test, dtype = self.ytr.dtype)

    # loop over all test rows
    for i in xrange(num_test):
      # find the nearest training image to the i'th test image
      # using the L1 distance (sum of absolute value differences)
      distances = np.sum(np.abs(self.Xtr - X[i,:]), axis = 1)
      min_index = np.argmin(distances) # get the index with smallest distance
      Ypred[i] = self.ytr[min_index] # predict the label of the nearest example

    return Ypred
Nếu bạn chạy đoạn mã này, bạn sẽ thấy rằng trình phân loại này chỉ đạt được ** 38,6% ** trên CIFAR-10. Điều đó ấn tượng hơn so với việc đoán ngẫu nhiên (sẽ cho độ chính xác 10% vì có 10 lớp), nhưng không ở gần hiệu suất của con người ước tính là khoảng 94% hoặc gần mạng nở-ron tích chập hiện đại đạt được khoảng 95%, khớp với độ chính xác của con người (xem bảng xếp hạng của một cuộc thi Kaggle gần đây trên CIFAR-10).
Việc lựa chọn khoảng cách. Có nhiều cách khác để tính toán khoảng cách giữa các vectơ. Một lựa chọn phổ biến khác có thể thay vào đó là sử dụng **khoảng cách L **, có cách giải thích hình học để tính toán khoảng cách euclide giữa hai vectơ. Khoảng cách có dạng:
\[d_2 (I_1, I_2) = \sqrt{\sum_{p} \left( I^p_1 - I^p_2 \right)^2}\]Nói cách khác, chúng ta sẽ tính toán sự khác biệt theo từng pixel như trước đây, nhưng lần này chúng ta bình phương tất cả chúng, cộng chúng lại và cuối cùng lấy căn bậc hai. Trong numpy, sử dụng mã ở trên, chúng ta sẽ chỉ cần thay thế một dòng duy nhất. Đó là dòng tính toán khoảng cách:
distances = np.sqrt(np.sum(np.square(self.Xtr - X[i,:]), axis = 1))
Note that I included the np.sqrt call above, but in a practical nearest neighbor application we could leave out the square root operation because square root is a monotonic function. That is, it scales the absolute sizes of the distances but it preserves the ordering, so the nearest neighbors with or without it are identical. If you ran the Nearest Neighbor classifier on CIFAR-10 with this distance, you would obtain 35.4% accuracy (slightly lower than our L1 distance result).
Lưu ý rằng tôi đã thêm lệnh gọi ‘np.sqrt’ ở trên, nhưng trong cách ứng dụng hàng xóm gần nhất thực tế, chúng ta có thể bỏ đi phép toán căn bậc hai vì căn bậc hai là một hàm đơn điệu. Có nghĩa là, nó thay đổi tỷ lệ kích thước tuyệt đối của khoảng cách nhưng nó bảo toàn thứ tự, vì vậy các láng giềng gần nhất có hoặc không có nó đều giống nhau. Nếu bạn chạy bộ phân loại láng giềng gần nhất trên CIFAR-10 với khoảng cách này, bạn sẽ nhận được độ chính xác **35,4% ** (thấp hơn một chút so với kết quả khoảng cách L1 của chúng tôi).
L1 vs. L2. Thật thú vị khi xem xét sự khác biệt giữa hai số liệu. Đặc biệt, khoảng cách L2 sẽ phạt nhiều so với khoảng cách L1 khi nói đến sự khác biệt giữa hai vectơ. Bởi vì, khoảng cách L2 thích nhiều bất đồng trung bình hơn là một bất đồng lớn. Khoảng cách L1 và L2 (hoặc tương đương với định mức L1/L2 về sự khác biệt giữa một cặp hình ảnh) là những trường hợp đặc biệt thường được sử dụng nhất của p-norm.
Bộ phân loại k Láng giềng gần nhất (k - Nearest Neighbor Classifier)
Bạn có thể nhận thấy rằng thật kỳ lạ khi chỉ sử dụng nhãn của hình ảnh gần nhất khi chúng tôi muốn đưa ra dự đoán. Thật vậy, hầu như luôn luôn là trong mọi trường hợp người ta có thể làm tốt hơn bằng cách sử dụng ** k-Nearest Neighbor Classifier . Ý tưởng rất đơn giản: thay vì tìm một hình ảnh gần nhất duy nhất trong tập huấn luyện, chúng ta sẽ tìm các hình ảnh gần nhất **k gần nhất và yêu cầu chúng bỏ phiếu trên nhãn của hình ảnh thử nghiệm. Đặc biệt, khi k = 1, chúng tôi có bộ phân loại láng giềng gần nhất. Bằng trực quan, các giá trị cao hơn của k có tác dụng làm mịn, giúp bộ phân loại chống lại các giá trị ngoại lai tốt hơn:

Trong thực tế, hầu như bạn sẽ luôn muốn sử dụng k-Nearest Neighbor. Nhưng bạn nên sử dụng giá trị nào của k? Chúng ta chuyển sang vấn đề này tiếp theo.
Tập dữ liệu kiểm định để điều chỉnh siêu tham số
The k-nearest neighbor classifier requires a setting for k. But what number works best? Additionally, we saw that there are many different distance functions we could have used: L1 norm, L2 norm, there are many other choices we didn’t even consider (e.g. dot products). These choices are called hyperparameters and they come up very often in the design of many Machine Learning algorithms that learn from data. It’s often not obvious what values/settings one should choose.
You might be tempted to suggest that we should try out many different values and see what works best. That is a fine idea and that’s indeed what we will do, but this must be done very carefully. In particular, we cannot use the test set for the purpose of tweaking hyperparameters. Whenever you’re designing Machine Learning algorithms, you should think of the test set as a very precious resource that should ideally never be touched until one time at the very end. Otherwise, the very real danger is that you may tune your hyperparameters to work well on the test set, but if you were to deploy your model you could see a significantly reduced performance. In practice, we would say that you overfit to the test set. Another way of looking at it is that if you tune your hyperparameters on the test set, you are effectively using the test set as the training set, and therefore the performance you achieve on it will be too optimistic with respect to what you might actually observe when you deploy your model. But if you only use the test set once at end, it remains a good proxy for measuring the generalization of your classifier (we will see much more discussion surrounding generalization later in the class).
Evaluate on the test set only a single time, at the very end.
Luckily, there is a correct way of tuning the hyperparameters and it does not touch the test set at all. The idea is to split our training set in two: a slightly smaller training set, and what we call a validation set. Using CIFAR-10 as an example, we could for example use 49,000 of the training images for training, and leave 1,000 aside for validation. This validation set is essentially used as a fake test set to tune the hyper-parameters.
Here is what this might look like in the case of CIFAR-10:
# assume we have Xtr_rows, Ytr, Xte_rows, Yte as before
# recall Xtr_rows is 50,000 x 3072 matrix
Xval_rows = Xtr_rows[:1000, :] # take first 1000 for validation
Yval = Ytr[:1000]
Xtr_rows = Xtr_rows[1000:, :] # keep last 49,000 for train
Ytr = Ytr[1000:]

# find hyperparameters that work best on the validation set
validation_accuracies = []
for k in [1, 3, 5, 10, 20, 50, 100]:

  # use a particular value of k and evaluation on validation data
  nn = NearestNeighbor()
  nn.train(Xtr_rows, Ytr)
  # here we assume a modified NearestNeighbor class that can take a k as input
  Yval_predict = nn.predict(Xval_rows, k = k)
  acc = np.mean(Yval_predict == Yval)
  print 'accuracy: %f' % (acc,)

  # keep track of what works on the validation set
  validation_accuracies.append((k, acc))
By the end of this procedure, we could plot a graph that shows which values of k work best. We would then stick with this value and evaluate once on the actual test set.
Split your training set into training set and a validation set. Use validation set to tune all hyperparameters. At the end run a single time on the test set and report performance.
Kiểm định chéo. In cases where the size of your training data (and therefore also the validation data) might be small, people sometimes use a more sophisticated technique for hyperparameter tuning called cross-validation. Working with our previous example, the idea is that instead of arbitrarily picking the first 1000 datapoints to be the validation set and rest training set, you can get a better and less noisy estimate of how well a certain value of k works by iterating over different validation sets and averaging the performance across these. For example, in 5-fold cross-validation, we would split the training data into 5 equal folds, use 4 of them for training, and 1 for validation. We would then iterate over which fold is the validation fold, evaluate the performance, and finally average the performance across the different folds.
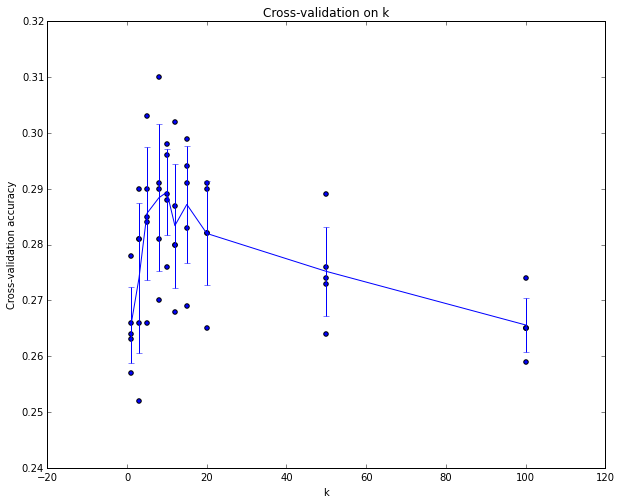
Trong thực tế. In practice, people prefer to avoid cross-validation in favor of having a single validation split, since cross-validation can be computationally expensive. The splits people tend to use is between 50%-90% of the training data for training and rest for validation. However, this depends on multiple factors: For example if the number of hyperparameters is large you may prefer to use bigger validation splits. If the number of examples in the validation set is small (perhaps only a few hundred or so), it is safer to use cross-validation. Typical number of folds you can see in practice would be 3-fold, 5-fold or 10-fold cross-validation.

Ưu điểm và nhược điểm của PP Các láng giềng gần nhất
It is worth considering some advantages and drawbacks of the Nearest Neighbor classifier. Clearly, one advantage is that it is very simple to implement and understand. Additionally, the classifier takes no time to train, since all that is required is to store and possibly index the training data. However, we pay that computational cost at test time, since classifying a test example requires a comparison to every single training example. This is backwards, since in practice we often care about the test time efficiency much more than the efficiency at training time. In fact, the deep neural networks we will develop later in this class shift this tradeoff to the other extreme: They are very expensive to train, but once the training is finished it is very cheap to classify a new test example. This mode of operation is much more desirable in practice.
As an aside, the computational complexity of the Nearest Neighbor classifier is an active area of research, and several Approximate Nearest Neighbor (ANN) algorithms and libraries exist that can accelerate the nearest neighbor lookup in a dataset (e.g. FLANN). These algorithms allow one to trade off the correctness of the nearest neighbor retrieval with its space/time complexity during retrieval, and usually rely on a pre-processing/indexing stage that involves building a kdtree, or running the k-means algorithm.
The Nearest Neighbor Classifier may sometimes be a good choice in some settings (especially if the data is low-dimensional), but it is rarely appropriate for use in practical image classification settings. One problem is that images are high-dimensional objects (i.e. they often contain many pixels), and distances over high-dimensional spaces can be very counter-intuitive. The image below illustrates the point that the pixel-based L2 similarities we developed above are very different from perceptual similarities:

Here is one more visualization to convince you that using pixel differences to compare images is inadequate. We can use a visualization technique called t-SNE to take the CIFAR-10 images and embed them in two dimensions so that their (local) pairwise distances are best preserved. In this visualization, images that are shown nearby are considered to be very near according to the L2 pixelwise distance we developed above:
In particular, note that images that are nearby each other are much more a function of the general color distribution of the images, or the type of background rather than their semantic identity. For example, a dog can be seen very near a frog since both happen to be on white background. Ideally we would like images of all of the 10 classes to form their own clusters, so that images of the same class are nearby to each other regardless of irrelevant characteristics and variations (such as the background). However, to get this property we will have to go beyond raw pixels.
Tổng kết
In summary:
- We introduced the problem of Image Classification, in which we are given a set of images that are all labeled with a single category. We are then asked to predict these categories for a novel set of test images and measure the accuracy of the predictions.
- We introduced a simple classifier called the Nearest Neighbor classifier. We saw that there are multiple hyper-parameters (such as value of k, or the type of distance used to compare examples) that are associated with this classifier and that there was no obvious way of choosing them.
- We saw that the correct way to set these hyperparameters is to split your training data into two: a training set and a fake test set, which we call validation set. We try different hyperparameter values and keep the values that lead to the best performance on the validation set.
- If the lack of training data is a concern, we discussed a procedure called cross-validation, which can help reduce noise in estimating which hyperparameters work best.
- Once the best hyperparameters are found, we fix them and perform a single evaluation on the actual test set.
- We saw that Nearest Neighbor can get us about 40% accuracy on CIFAR-10. It is simple to implement but requires us to store the entire training set and it is expensive to evaluate on a test image.
- Finally, we saw that the use of L1 or L2 distances on raw pixel values is not adequate since the distances correlate more strongly with backgrounds and color distributions of images than with their semantic content.
In next lectures we will embark on addressing these challenges and eventually arrive at solutions that give 90% accuracies, allow us to completely discard the training set once learning is complete, and they will allow us to evaluate a test image in less than a millisecond.
Tổng kết: Áp dụng kNN vào thực tế
If you wish to apply kNN in practice (hopefully not on images, or perhaps as only a baseline) proceed as follows:
- Preprocess your data: Normalize the features in your data (e.g. one pixel in images) to have zero mean and unit variance. We will cover this in more detail in later sections, and chose not to cover data normalization in this section because pixels in images are usually homogeneous and do not exhibit widely different distributions, alleviating the need for data normalization.
- If your data is very high-dimensional, consider using a dimensionality reduction technique such as PCA (wiki ref, CS229ref, blog ref) or even Random Projections.
- Split your training data randomly into train/val splits. As a rule of thumb, between 70-90% of your data usually goes to the train split. This setting depends on how many hyperparameters you have and how much of an influence you expect them to have. If there are many hyperparameters to estimate, you should err on the side of having larger validation set to estimate them effectively. If you are concerned about the size of your validation data, it is best to split the training data into folds and perform cross-validation. If you can afford the computational budget it is always safer to go with cross-validation (the more folds the better, but more expensive).
- Train and evaluate the kNN classifier on the validation data (for all folds, if doing cross-validation) for many choices of k (e.g. the more the better) and across different distance types (L1 and L2 are good candidates)
- If your kNN classifier is running too long, consider using an Approximate Nearest Neighbor library (e.g. FLANN) to accelerate the retrieval (at cost of some accuracy).
- Take note of the hyperparameters that gave the best results. There is a question of whether you should use the full training set with the best hyperparameters, since the optimal hyperparameters might change if you were to fold the validation data into your training set (since the size of the data would be larger). In practice it is cleaner to not use the validation data in the final classifier and consider it to be burned on estimating the hyperparameters. Evaluate the best model on the test set. Report the test set accuracy and declare the result to be the performance of the kNN classifier on your data.
Bài viết khác
Here are some (optional) links you may find interesting for further reading:
-
A Few Useful Things to Know about Machine Learning, where especially section 6 is related but the whole paper is a warmly recommended reading.
-
Recognizing and Learning Object Categories, a short course of object categorization at ICCV 2005.